
The Office of Institutional Research and Assessment supports the college by providing data and consultation for organizational planning and assessment. It also conducts extensive research to improve institutional processes and outcomes.
Institutional Research and Assessment (IRA) is the research arm of the College for internal decision-making and internal and external reporting, and it provides leadership ensuring the enterprise’s accreditation status. At the heart of IRA is a concern for student learning and effective organizational functioning.
Sylvia J. Sievers, Ph.D.
Director of Institutional Research and Assessment
864-833-8757
sjsievers@presby.edu
National Student Clearinghouse Student Insights Dashboard
The National Student Clearinghouse Student Insights Dashboard is built around the idea that easier access to better data about educational institutions and trends empowers parents, students, and education professionals to make better decisions about higher education.
Student Achievement
In accordance with the Southern Association of Colleges and Schools Commission on Colleges (SACSCOC) Standard 8.1, “The institution identifies, evaluates, and publishes goals and outcomes for student achievement appropriate to the institution’s mission…,” Presbyterian College has identified student achievement metrics, provided appropriate data, established thresholds of acceptability, and explained how each criterion relates to its mission.
The College holds five goals for student achievement and success:
- Six-year graduation rates (150% of normal enrollment length) of first-time, full-time, bachelor’s degree seeking students will exceed the Southeast Regional average.
- Fall-to-fall retention rates for first-time, full-time, bachelor’s degree seeking students at PC will exceed the Southeast Regional average.
- Overall career outcome rates for baccalaureate graduates will exceed the National Association of Colleges and Employers (NACE) Southeast Regional rate.
- The College will meet or exceed national/state pass rates for its Education Department programs leading to licensure or certification.
- The College’s graduate programs will meet or exceed the following on-time graduation rates:
- School of Pharmacy: 76%
- Physician Assistant Studies: 90%
- Occupational Therapy: 95%
Presbyterian College’s mission statement indicates that the College is dedicated to helping students “gain a basic knowledge of humanities, natural sciences, and social sciences; a special competence in one or more particular areas of study; and an ability to see these studies as part of the larger search for truth.” Each measure is in alignment with the College’s mission statement. The College strives to attain the highest student achievement outcomes possible, which often exceed those of the regional average of Liberal Arts Colleges.
Graduation Rates
Presbyterian College monitors and reports graduation rates according to the guidelines of the Graduation Rate Survey (GRS), a component of the Integrated Postsecondary Education Data Systems (IPEDS).
The following table includes PC’s 4-year and 6-year undergraduate graduation rates of incoming first-time students from the entering cohorts of 2013 through 2016.
| IPEDS Reporting Year | 2019 | 2020 | 2021 | 2022 |
| IPEDS Cohort Year | 2013 | 2014 | 2015 | 2016 |
| 4-year graduation rate | 61% | 53% | 50% | 53% |
| 6-year graduation rate | 68% | 61% | 59% | 60% |
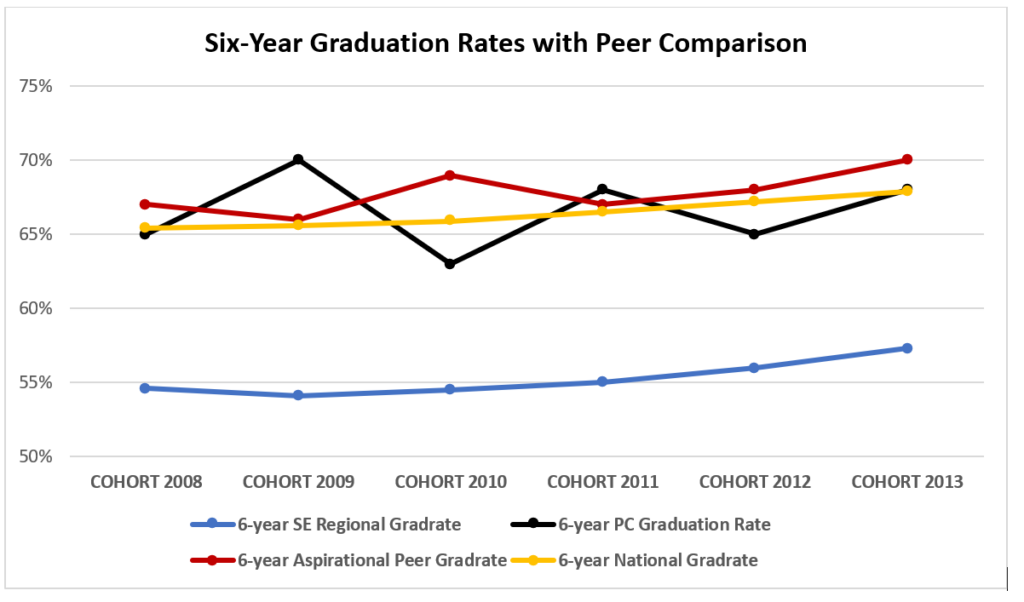
Each year, IPEDS delivers a Data Feedback Report comparing Presbyterian College to 23 aspirational peer institutions. NCES also provides multi-year 6-year graduation rates for national and regional peer institutions for additional comparison. The following chart represents Presbyterian College’s 6-year undergraduate graduation rates in comparison to those of its aspirational peers as well as the rates for the national and southeast regional, four-year, bachelor degree-granting, private non-profit peer institutions.
The following table represents the percentage of graduate students who completed the Pharmacy Doctoral degree within four years and the Physician Assistant Studies program within two years.
| Graduation Rate | 2018 | 2019 | 2020 | 2021 | 2022 |
| Pharmacy graduate rate | 80% | 80% | 63% | 78% | 79% |
| Physician Assistant graduation rate | No cohort | No cohort | No cohort | 100% | 97% |
Retention Rates
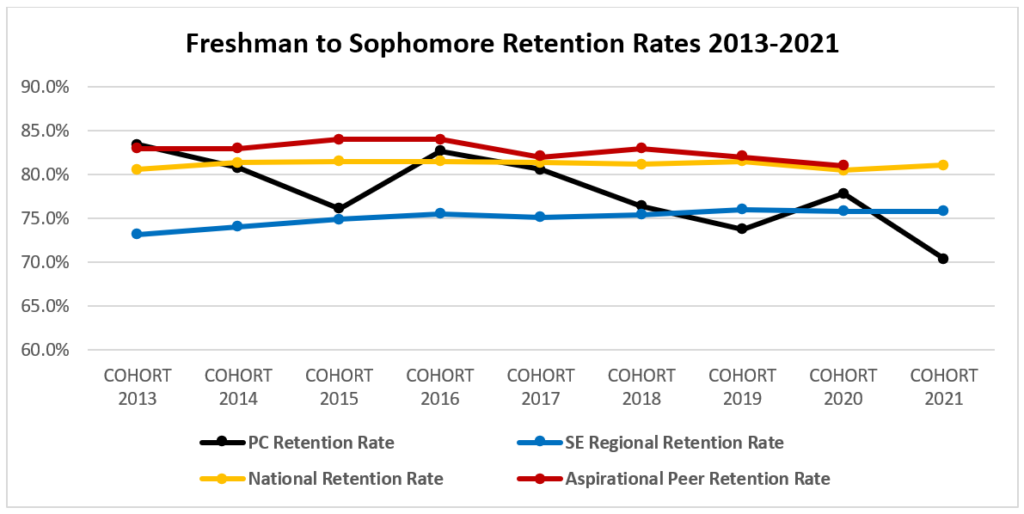
The following chart represents Presbyterian College’s fall-to-fall, first-year to sophomore year retention rates in comparison to those of its aspirational peers as well as the national and southeast regional, four-year, bachelor degree-granting, private non-profit peer institutions for the past nine cohorts.
Publication of Goals and Outcomes
Presbyterian College’s student achievement criteria, thresholds, and aspirational targets summarized above are discussed in greater detail in a Student Achievement Goals and Outcomes document published below and updated annually.
National Survey of Student Engagement (NSSE)
The National Survey of Student Engagement (NSSE) gathers information from colleges and universities about student participation in programs and activities that institutions provide for student learning and personal development. The results provide an estimate of how undergraduates spend their time and what they gain from attending college.